
How Global Events Impact Your Portfolio: The Hidden Forces Behind Your Wealth
January 3, 2026
digital@omegafinancial.co.in
The US Dollar (USD) hitting 90 Indian Rupees (INR) represents a notable development in forex markets, driven by global economic dynamics, US monetary policy, and India’s internal factors.
As of late 2025, this level underscores ongoing rupee pressures. For those in India tracking investments, this shift carries implications for portfolios, remittances, travel costs, and broader economic exposure. This article draws solely from authorized sources like the Reserve Bank of India (RBI), US Federal Reserve, and official data platforms to present verified data, historical context, and observed market patterns.
Current and Historical Exchange Data
Official rates are published daily by the RBI and the Foreign Exchange Dealers’ Association of India (FEDAI), with interbank reference rates from the RBI.
1. Latest RBI Reference Rate (as of December 26, 2025):
USD/INR closed at 789.95 (RBl website:rbi.org.in/Scripts/ReferenceRates.aspx). This mid-market rate guides banking transactions and is updated daily around 11:30 AM IST.
2. Historical Peaks:
Data from RBl’s Database on Indian Economy (dbie.rbi.org.in) indicates a ~5.5% year-over-year (YoY) rupee depreciation in 2025, from ~785 in January.
3. Federal Reserve Context:
The US Fed funds rate is 4.25-4.50% (federalreserve.gov, Dec 18, 2025 FOMC statement), influencing dollar strength. India’s repo rate remains at 6.50% (RBI MPC, Dec 2025).
4. Trade and Reserves:
India’s current account deficit stood at 1.7% of GDP in Q2 FY26 (RBI Bulletin, Nov 2025), amid oil imports at $80-90/barrel (OPE data via rbi.org.in). Forex reserves: $682 billion (RBI, Dec 26, 2025), down 2% from summer highs.
RBI data confirms the 90 level as a psychological benchmark, referenced in State Bank of India (SBI) research reports (sbi.co.in).
Factors Behind the Rupee’s Movement
Rupee depreciation at this level reflects:
1. Global Influences: US GDP growth at 3.1% in Q3 2025 (BEA.gov) and Fed policy versus broader slowdowns.
2. Domestic Elements: CPI inflation at 5.5% (RB| data), FIl outflows of $15B from Indian equities in 2025 (NSEIndia.com), and oil-related geopolitical tensions.
3. RBI Role: The central bank intervened by selling $25B in reserves year-to-date (RBI weekly stats) to manage volatility, with a historical target of 5-6% annual depreciation.
Investment Perspectives: Observed Patterns for Indians
A USD at 790 level highlights historical patterns in how currency shifts interact with Indian markets:
1. Dollar-Denominated Exposure
Past data shows rupee depreciation (e.g., 30% over 2018-2023, RBl) amplifying INR returns from US assets. NRI deposits reached 73.5 lakh crore, up 20% YoY (RBI, 2025), reflecting flows amid rate differentials.
2. Export-Oriented Sectors
- Companies with dollar revenues, like IT firms (TCS, Infosys; 70% export mix per BSE filings), have shown revenue gains tied to forex movements-TCS Q3 FY26 up 8% YoY (tcs.com). Nifty IT index rose 12% in 2025 (NSEIndia.com).
- Pharma and textiles sectors have historically seen margin expansions with rupee weakness (ICRA ratings, icra.in).
3. Gold and Commodities
Gold in IN reached 78,000/10g (MCXIndia.com, Dec 2025), up 25% Yor, aligning with its role as a traditional hedge.
4. Debt, Remittances, and Costs
- External debt servicing costs rise with depreciation (RBI data). NRIs observe more INR per dollar remitted via authorized channels (e.g., SBl forex).
- RBl’s Master Circular on Forex (rbi.org.in) notes volatility risks for unhedged exposures.
5. Fixed Income Context
RBI bonds yield 7-7.5% (rbiretaildirect.org.in), amid projections like potential Fed rate cuts (CME FedWatch Tool).
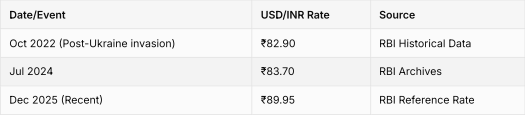
Historical Scenario Patterns.
Key Observations for Indian Investors
1. Hedging Patterns: Allocations to USD assets via LRS (up to $250K/year, RBI) have historically compounded during depreciation cycles.
2. Sector Sensitivities: Export-heavy areas like IT/pharma tend to benefit, while import-dependent ones face pressures.
3. Monitoring Tools: RB| daily rates (rbi.org.in), NSE/BSE data provide real-time insights.
4. Long-Term Trend: Rupee’s 4-5% average annual depreciation over 10 years (RBI data) shapes multi-year planning.
5. Reserve Buffer: RBI’s $680B reserves historically prevent extreme volatility.